
Introduction
If you followed Weeks 1 and 2, you have a strategic foundation and measured your readiness. If you already had the foundation in place, you verified it works. Either way, you know where you stand strategically.
Now comes the critical question most companies get wrong: where does AI actually fit in your strategy?
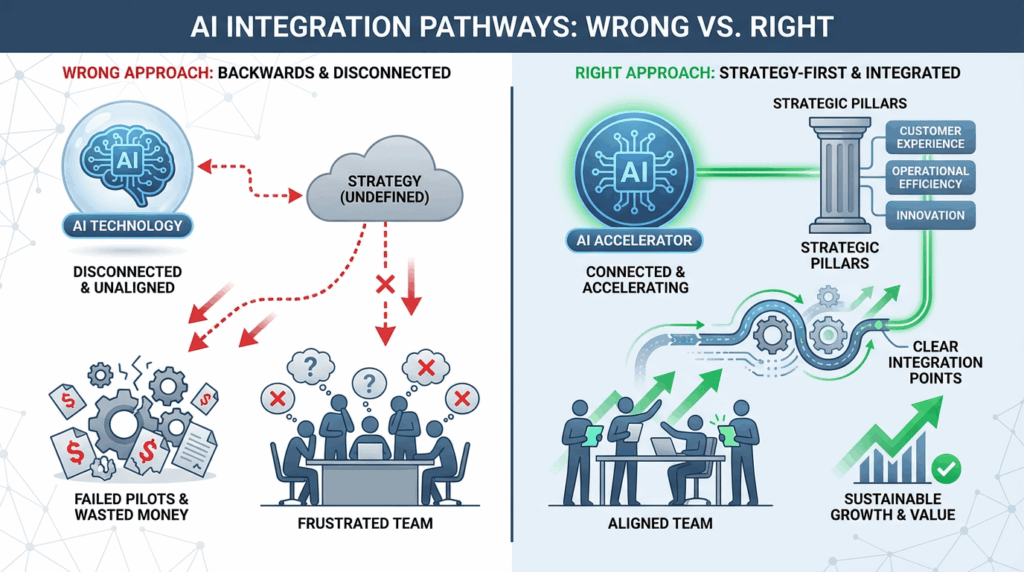
Most companies approach AI backwards. They see competitors using AI, read about AI success stories, get pressure from investors about their “AI strategy.” So they start AI projects without knowing if they make sense.
Three months later, they’ve spent $50,000-$200,000 and have nothing to show for it. The team is frustrated. The AI pilot works technically but delivers no business value and they still don’t know which AI opportunities are worth pursuing.
Week 3 fixes that problem. This is about integrating AI into corporate strategy, not bolting it on afterwards. Strategy before technology. Determine where AI fits before selecting tools.
Note on overlap with previous weeks: Yes, this references concepts from Weeks 1-2. That’s intentional. Week 1 built strategy, week 2 verified readiness and week 3 determines where AI accelerates that strategy. If you see familiar concepts, it’s because we’re now applying them specifically to AI integration.
The Problem: Technology-First Thinking
Here’s the pattern I see constantly: Companies hear “AI can transform your business.” They believe it, they hire data scientists or AI consultants. They launch pilots, they demo impressive technology.
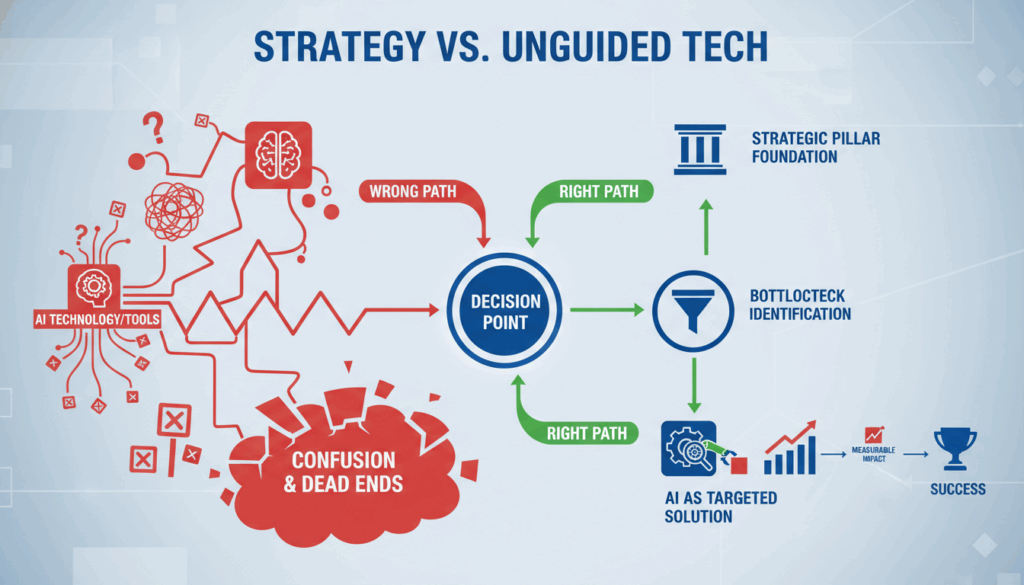
Then nothing scales. Why? Because they started with technology instead of strategy. They asked “how can we use machine learning?” instead of “what business problems does AI actually solve for us?”
The symptoms show up everywhere: AI projects that work technically but deliver no business value, multiple AI initiatives that don’t connect to strategic pillars, data scientists building models nobody uses, pilots that never reach production because they don’t solve real problems, and executives who can’t explain why they’re investing in AI.
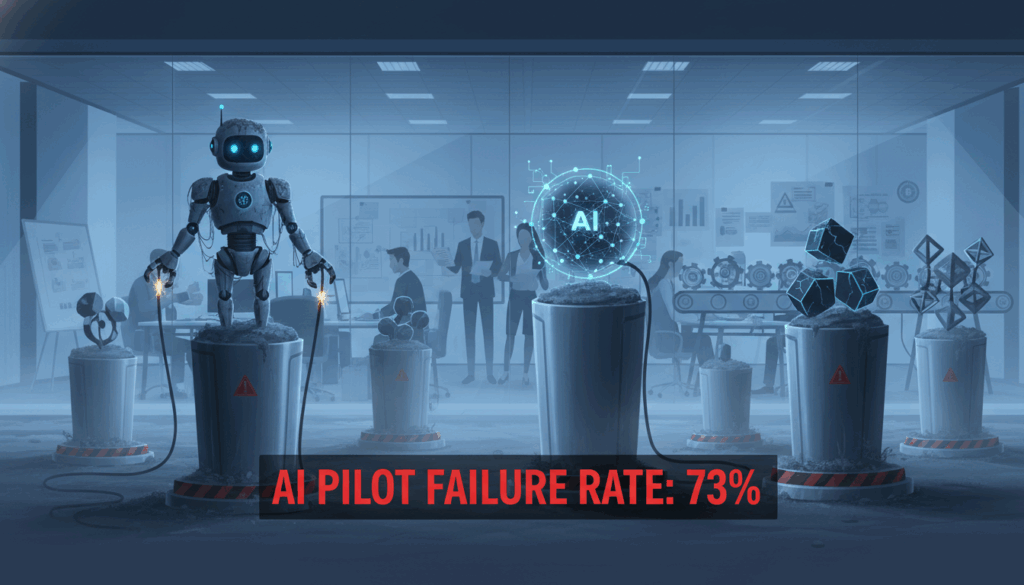
The cost is staggering. Research shows 73% of AI projects fail at implementation, not because the technology doesn’t work, but because companies never connected AI to business strategy, automated the wrong things, optimized for metrics that don’t matter, and solved problems customers don’t have.
This week prevents that failure. You’ll map AI opportunities to strategic outcomes, assess where AI can actually make 10x progress, define AI-enabled KPIs, assign ownership, and establish governance.
Key Principle: Strategy Before Technology
Before you evaluate any AI tool, model, or vendor, you must answer one question: Where does AI accelerate achievement of our strategic pillars?
Not “what can AI do?” but “what do we need AI to do to achieve our strategy?”
This requires reversing the typical AI evaluation process. The wrong approach starts by exploring AI capabilities, then identifying potential use cases, building pilots, trying to connect them to business value, and wondering why nothing scales. The right approach starts with strategic pillars from Week 1, identifies bottlenecks preventing pillar achievement, assesses if AI removes those bottlenecks, builds only the AI that directly accelerates pillars, and measures impact on pillar KPIs.
Example from our healthcare company:
Strategic Pillar: Operational Excellence – reduce cost per order from $47 to $35
Bottleneck analysis: The company identified that manual order entry takes 2 hours per order creating high labor costs, error rates of 8% require rework adding quality costs, and process variation by employee leads to inconsistent outcomes.
AI opportunity assessment: They evaluated whether AI could automate order entry to reduce labor cost, reduce errors to improve quality, and standardize the process to ensure consistency, finding yes on all three fronts.
Business case: Automating 70% of orders would save 1.4 hours per order, reducing errors from 8% to 2% would eliminate most rework, and the combined impact would deliver a $15 cost reduction per order, getting them 75% of the way to the $35 target.
Decision: This AI project directly supports the strategic pillar, so they funded it.
Compare that to a different AI idea someone proposed: “Use AI to predict customer churn.”
Strategic pillar check: They asked which pillar this supports and found it doesn’t support Operational Excellence since it doesn’t reduce cost, doesn’t support Selective Growth since that pillar focuses on acquiring new customers rather than retention, and isn’t related to Talent Retention at all.
Decision: This might be a good idea, but it doesn’t support current strategic pillars, so they deferred it.
That’s strategy before technology. Every AI investment must pass this test.
Component 1: Strategy Outcome Mapping
Strategy Outcome Mapping connects every strategic pillar to measurable outcomes, then rates each outcome by business impact and current capability. This reveals where AI can have maximum effect: high-impact outcomes where current capability is low.
The Mapping Process
Start with your strategic pillars from Week 1. For each pillar, list the specific outcomes required to achieve it.
Healthcare company example – Operational Excellence pillar:
The company identified five outcomes required for pillar achievement: reduce cost per order from $47 to $35, improve on-time delivery from 88% to 95%, reduce error rate from 8% to 2%, decrease order-to-delivery cycle time from 18 days to 10 days, and increase process automation from 30% to 60%.
For each outcome, rate two dimensions on a 1-10 scale:
Business Impact: How much does achieving this outcome advance the pillar? Score 1-3 for nice to have with minimal impact, 4-6 for moderate impact that supports the pillar, 7-8 for significant impact that’s critical to the pillar, or 9-10 for transformative impact where the pillar depends on this outcome.
Current Capability: How well can we achieve this outcome today? Score 1-3 for severely limited with major gaps, 4-6 for partially capable with inconsistent results, 7-8 for mostly capable needing minor improvements, or 9-10 for excellent capability where you’re already performing well.
Healthcare company ratings:
| Outcome | Business Impact | Current Capability | Gap Score |
| Reduce cost per order | 10 | 3 | 7 |
| Improve on-time delivery | 8 | 5 | 3 |
| Reduce error rate | 9 | 2 | 7 |
| Decrease cycle time | 7 | 4 | 3 |
| Increase automation | 8 | 3 | 5 |
Gap Score = Impact – Capability
The highest gap scores show where AI can have maximum impact. Focus there first.
For the healthcare company, “reduce cost per order” and “reduce error rate” both have 7-point gaps. These are prime AI candidates because they’re critical to the pillar (high impact) and current capability is low.
The Output: Strategy Outcome Map
Create a visual map for each strategic pillar showing:
-
- All outcomes required for pillar achievement
-
- Impact and capability ratings for each
-
- Gap scores highlighting AI priorities
-
- Dependencies between outcomes
This becomes your filter for evaluating AI opportunities. If an AI idea doesn’t address a high-gap outcome, it doesn’t make the cut.
Component 2: AI Opportunity Assessment
Now that you know which outcomes need AI, assess specific AI opportunities using a systematic framework.
The Assessment Criteria
Every AI opportunity must be evaluated on four dimensions:
1. Strategic Alignment (0-10) Does this AI directly support a high-gap outcome from your Strategy Outcome Map? Score 0-3 for tangential connection to strategy, 4-6 for supporting strategy indirectly, 7-8 for directly supporting strategic outcomes, or 9-10 for being critical to achieving strategic pillars.
2. Technical Feasibility (0-10) Can you actually build this with your data, skills, and resources? Score 0-3 for major technical barriers that make it likely infeasible, 4-6 for technically possible but challenging, 7-8 for feasible with current resources, or 9-10 for straightforward implementation.
3. Business Impact (0-10) If successful, how much does this move the needle on pillar KPIs? Score 0-3 for minimal measurable impact, 4-6 for modest improvement, 7-8 for significant improvement, or 9-10 for transformational improvement.
4. Implementation Effort (0-10, inverse scoring) How much time, money, and resources required? Score 0-3 for massive investment taking 12+ months, 4-6 for significant investment taking 6-12 months, 7-8 for moderate investment taking 3-6 months, or 9-10 for minimal investment under 3 months.
Total Opportunity Score = (Strategic Alignment + Business Impact + Technical Feasibility + Implementation Effort) / 4
The Healthcare Company Assessment
They evaluated three AI opportunities:
AI Opportunity #1: Automate Order Entry Strategic Alignment scored 9 since it directly addresses the cost per order outcome, Technical Feasibility scored 8 because they have clean data and proven technology, Business Impact scored 9 for saving $15 per order, and Implementation Effort scored 7 for 3-4 months to build, giving a total score of 8.25.
AI Opportunity #2: Predictive Equipment Maintenance Strategic Alignment scored only 5 as it’s loosely related to on-time delivery, Technical Feasibility scored 4 due to limited equipment sensor data, Business Impact scored 6 for possibly improving uptime marginally, and Implementation Effort scored 3 since they need new sensors requiring 12+ months, giving a total score of 4.5.
AI Opportunity #3: Quality Inspection Automation Strategic Alignment scored 10 since it directly addresses the error rate outcome, Technical Feasibility scored 7 because computer vision is proven but they need training data, Business Impact scored 8 for reducing errors from 8% to 2%, and Implementation Effort scored 6 for the 6 months needed to collect image data, giving a total score of 7.75.
Decision: Fund opportunities #1 and #3. They score above 7.5 and directly support strategic pillars. Defer #2—the score is too low and strategic alignment is weak.
Quick Win vs. Strategic Bet Classification
Plot opportunities on a 2×2 matrix:
-
- X-axis: Implementation Effort (low to high)
-
- Y-axis: Strategic Alignment + Business Impact (low to high)
This creates four quadrants: Quick Wins with high value and low effort where you should start, Strategic Bets with high value and high effort that you plan for later, Fill-Ins with low value and low effort that you consider if you have extra resources, and Time Sinks with low value and high effort that you should avoid.
The healthcare company classified their AI opportunities accordingly: Automate Order Entry fell into Quick Wins with high value and moderate effort, Quality Inspection became a Strategic Bet with high value but higher effort, and Predictive Maintenance landed in the Avoid category with moderate value but very high effort.
Start with Quick Wins. They deliver fast ROI and build organizational confidence in AI before tackling Strategic Bets.
Component 3: KPI Cascading for AI Initiatives
AI initiatives need KPIs that cascade from corporate goals to individual work—just like Week 1, but now specifically for AI-enabled outcomes.
Defining AI-Enabled KPIs
For each approved AI opportunity, define KPIs at four levels:
Corporate Level KPI: How does this AI support pillar achievement?
Example – Automate Order Entry:
-
- Corporate KPI: Operating margin improves from 10.5% to 12%
-
- AI Contribution: Order automation reduces cost per order by $15, contributing to margin improvement
Department Level KPI: What must the department deliver?
Example – Operations Department:
-
- Department KPI: Reduce cost per order from $47 to $35
-
- AI-Enabled Target: Automation handles 70% of orders with <1% error rate
Team Level KPI: What does the AI implementation team deliver?
Example – Process Automation Team:
-
- Team KPI: Deploy order entry automation to production
-
- Success Metrics: 70% automation rate, <1% error rate, <2 second processing time
Individual Level KPI: What does each person own?
Example – Data Scientist:
-
- Individual KPI: Build and train order entry model
-
- Success Metrics: 95% accuracy on test data, <500ms inference time
Example – Integration Engineer:
-
- Individual KPI: Integrate model with order management system
-
- Success Metrics: End-to-end processing <2 seconds, 99.9% uptime
Leading vs. Lagging Indicators for AI
AI initiatives need both types of KPIs:
Lagging Indicators measure final outcomes like cost reduction achieved, error rate improvement, customer satisfaction increase, and revenue impact.
Leading Indicators predict if you’ll hit lagging indicators by tracking model accuracy on validation data, system processing speed, automation adoption rate, and user feedback scores.
The healthcare company tracked cost per order as their lagging indicator measured monthly, while their leading indicators included orders processed by AI versus manual measured daily, AI error rate versus manual error rate measured daily, average processing time measured in real-time, and user satisfaction with the AI system measured weekly.
If leading indicators trend poorly, you know lagging indicators will miss targets. This gives time to course-correct before quarter-end.
The Cascade Map
Document the complete KPI cascade visually:
Corporate KPI: 12% Operating Margin
↓
Pillar KPI: Reduce Cost Per Order to $35
↓
AI Initiative KPI: 70% Order Automation with <1% Error
↓
Department KPIs: Operations automation rate, error rate
↓
Team KPIs: Model accuracy, system integration, user adoption
↓
Individual KPIs: Specific deliverables per person
Everyone should be able to trace their AI work directly to corporate strategy.

Component 4: Ownership Assignment
AI initiatives fail when nobody owns outcomes. “Shared ownership” means no ownership.
The RACI Framework for AI
RACI defines four roles for every AI initiative:
R – Responsible: Does the work A – Accountable: Owns the outcome C – Consulted: Provides input I – Informed: Kept updated
Critical rule: Each task has ONE Accountable person. Multiple people can be Responsible, Consulted, or Informed, but only one person is Accountable.
Healthcare Company RACI – Order Entry Automation
| Task/Decision | CEO | CFO | COO | CTO | VP Ops | Data Science Lead | Integration Engineer |
| Overall AI Strategy | A | C | C | C | I | I | I |
| Pillar: Operational Excellence | C | C | A | I | R | I | I |
| AI Opportunity Selection | C | C | C | A | C | R | I |
| Order Automation Project | I | I | C | A | C | R | R |
| Model Development | I | I | I | C | C | A | C |
| System Integration | I | I | I | C | C | C | A |
| Production Deployment | I | I | C | A | C | R | R |
| Ongoing Monitoring | I | I | C | C | A | R | C |
Several key patterns emerged from this RACI: The CEO is accountable for overall AI strategy tying to corporate goals, the COO is accountable for the Operational Excellence pillar owning the business outcome, the CTO is accountable for AI opportunity selection deciding which AI to build, the Data Science Lead is accountable for model development owning technical quality, the Integration Engineer is accountable for system integration owning production deployment, and the VP Operations is accountable for ongoing monitoring owning business results. Notice how accountability shifts from strategy to selection to development to deployment to operations, with different people owning different phases but always one accountable person at each stage.
C-Suite Collective Ownership
The C-suite owns AI strategy collectively, making decisions together about which strategic pillars get AI investment, budget allocation across AI initiatives, risk tolerance for AI experimentation, and timeline expectations for AI ROI. But individual C-suite members own specific pillars: in the healthcare company the CFO owns financial outcomes through margin improvement, the COO owns operational outcomes through cost reduction, and the CTO owns technical execution through AI development.
This prevents the common problem where “everyone owns AI” so nobody owns AI.
Functional Execution Ownership
Functions own execution of AI within their domain. Operations owns defining process requirements for automation, training employees on AI tools, monitoring AI performance in production, and escalating issues when AI fails. IT and Engineering owns building and deploying AI systems, maintaining AI infrastructure, ensuring AI security and compliance, and providing technical support. Data and Analytics owns developing AI models, monitoring model performance, retraining models as data changes, and ensuring data quality. Each function has clear boundaries preventing finger-pointing when AI projects hit problems.
Component 5: Governance Setup
AI governance prevents AI chaos. Without governance, every department launches AI pilots independently, nobody coordinates, and the company ends up with fragmented systems that don’t integrate.
The AI PMO Structure
Establish a lightweight PMO (Program Management Office) focused on AI initiatives. This doesn’t need to be a separate team—it’s a governance structure.
PMO Responsibilities: The PMO maintains the AI opportunity pipeline, tracks progress on all AI initiatives, coordinates dependencies between projects, escalates blockers to appropriate executives, and reports on AI portfolio health.
PMO Composition: The PMO includes a PMO Lead who owns the governance process and often reports to the CTO or COO, a technical representative usually the Data Science Lead, a business representative usually from Operations or Product, and an executive sponsor who is a C-suite member removing blockers.
The healthcare company’s AI PMO:
-
- PMO Lead: VP of Operations
-
- Technical rep: Data Science Lead
-
- Business rep: Process Improvement Manager
-
- Executive sponsor: CTO
Meets weekly for 30 minutes to review:
-
- Progress on active AI initiatives
-
- Blockers requiring escalation
-
- New AI opportunities for evaluation
-
- Resource conflicts between projects
Reporting Cadence
AI governance requires regular reporting at three levels:
Weekly Operational Reviews (30 minutes)
-
- Who attends: AI PMO + project teams
-
- Focus: Tactical progress and blockers
-
- Format: Each project reports 3 things:
-
- Progress this week (what shipped)
-
- Plans next week (what will ship)
-
- Blockers needing help
-
- Format: Each project reports 3 things:
Monthly Strategic Reviews (90 minutes)
-
- Who attends: C-suite + AI PMO + pillar owners
-
- Focus: AI initiative health and resource decisions
-
- Format: Each AI initiative reports:
-
- KPI performance vs. targets
-
- Budget burn vs. plan
-
- Timeline status
-
- Risk factors emerging
-
- Resource needs changing
-
- Format: Each AI initiative reports:
Quarterly Board Reviews (as part of regular board meeting)
-
- Who attends: Board + CEO + relevant C-suite
-
- Focus: AI portfolio ROI and strategy alignment
-
- Format: Portfolio-level metrics:
-
- Total AI investment vs. budget
-
- ROI achieved vs. projected
-
- Strategic pillar impact
-
- Lessons learned and course corrections
-
- Format: Portfolio-level metrics:
Decision Rights for AI
Document who can approve what decisions without escalation:
AI Opportunity Evaluation (<$25K)
-
- Decision maker: CTO + PMO Lead
-
- Timeline: 1 week
-
- Requirements: Must align with strategic pillar, technical feasibility confirmed
AI Pilot Funding ($25K-$100K)
-
- Decision maker: C-suite consensus
-
- Timeline: 2 weeks
-
- Requirements: Full business case, resource plan, success criteria
Production Deployment (any budget)
-
- Decision maker: Pillar Owner + CTO
-
- Timeline: Immediate if KPIs met, defer if not
-
- Requirements: Pilot success criteria achieved, operational readiness confirmed
AI Budget Reallocation (between initiatives)
-
- Decision maker: CEO + CFO
-
- Timeline: Monthly strategic review
-
- Requirements: Clear justification, impact on other initiatives assessed
AI Strategy Pivot (change strategic approach)
-
- Decision maker: Board approval required
-
- Timeline: Quarterly review
-
- Requirements: Evidence current approach failing, alternative approach validated
Clear decision rights prevent the common problem where AI projects get stuck waiting for approvals from unclear stakeholders.
The Deliverable: RACI Matrix + AI Governance Operating Model
By end of Week 3, you produce two documents:
Document 1: RACI Matrix
A spreadsheet showing Responsible, Accountable, Consulted, Informed for:
-
- Overall AI strategy
-
- Each strategic pillar
-
- Each AI initiative
-
- Key decision points (opportunity selection, pilot funding, deployment, etc.)
Document 2: AI Governance Operating Model
A 5-10 page document defining:
Section 1: AI Strategy Overview
-
- How AI supports strategic pillars
-
- Budget allocated to AI initiatives
-
- Expected ROI and timeline
Section 2: AI PMO Structure
-
- PMO composition and responsibilities
-
- Meeting cadence and attendees
-
- Escalation paths for blockers
Section 3: AI Decision Rights
-
- Who approves what
-
- Budget thresholds requiring different approvals
-
- Timeline expectations for decisions
Section 4: AI KPI Framework
-
- Corporate-level AI metrics
-
- Department-level AI metrics
-
- Project-level success criteria
-
- Reporting frequency for each
Section 5: Risk Management
-
- Technical risks (data quality, model accuracy, system integration)
-
- Business risks (ROI, customer adoption, competitive response)
-
- Operational risks (resource constraints, skill gaps, change management)
-
- Mitigation plans for each
These documents go to your board. They’re the proof you’re approaching AI strategically, not randomly.
The Healthcare Company: Their Week 3 Results
After Weeks 1-2, the healthcare company had:
-
- Strategic foundation with three pillars
-
- Strategic readiness score of 38/50 (moderate foundation)
Week 3 integrated AI into that strategy:
Strategy Outcome Mapping revealed:
-
- Highest-gap outcome: Reduce cost per order (10 impact, 3 capability, 7 gap)
-
- Second-highest: Reduce error rate (9 impact, 2 capability, 7 gap)
AI Opportunity Assessment identified:
-
- Quick Win: Automate Order Entry (score 8.25)
-
- Strategic Bet: Quality Inspection Automation (score 7.75)
-
- Deferred: Predictive Maintenance (score 4.5)
KPI Cascading defined:
-
- Corporate: 12% operating margin
-
- Pillar: $35 cost per order
-
- AI Initiative: 70% automation with <1% error
-
- Department: Operations automation rate
-
- Individual: Data scientist owns model accuracy
RACI Matrix assigned:
-
- CEO: Accountable for overall AI strategy
-
- CTO: Accountable for AI opportunity selection
-
- Data Science Lead: Accountable for model development
-
- VP Operations: Accountable for business results
Governance established:
-
- Weekly AI PMO reviews
-
- Monthly C-suite AI portfolio reviews
-
- Quarterly board AI ROI reports
-
- Clear decision rights for AI investments
The result: Clear roadmap for AI integration. No random AI pilots. No technology looking for problems. Just focused AI investment supporting strategic pillars with clear ownership and governance.
Three months later, they launched order entry automation. It worked because it was strategically grounded, properly resourced, and clearly governed.
Common Mistakes in AI-Strategy Integration
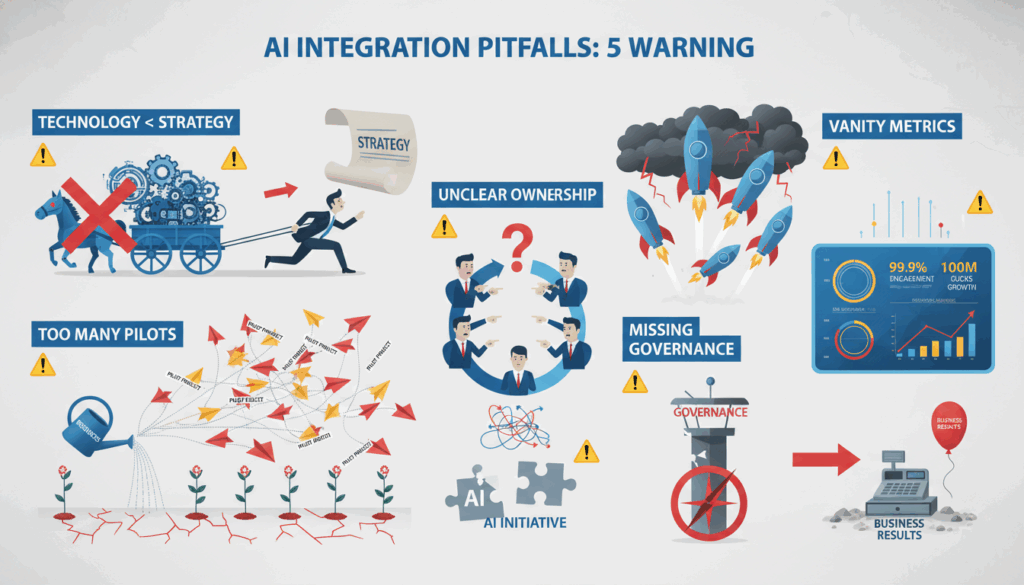
Mistake 1: Technology-First Selection
What it looks like: “Let’s use GPT-4” or “We need a recommendation engine” without asking if these solve strategic problems.
Why it fails: Technology that doesn’t support strategy delivers no business value, even if technically impressive.
Fix: Always start with strategic outcomes, then evaluate if AI addresses them.
Mistake 2: Pilot Proliferation
What it looks like: Ten AI pilots running simultaneously, each owned by different departments, none coordinated.
Why it fails: Resources spread thin, no pilots get proper attention, nothing reaches production.
Fix: Limit to 2-3 AI initiatives at a time. Finish and deploy before starting new pilots.
Mistake 3: Unclear Ownership
What it looks like: “The AI team owns AI” or “Everyone’s responsible for AI success.”
Why it fails: When everyone owns something, nobody owns it. Blockers don’t get resolved. Decisions don’t get made.
Fix: Use RACI matrix. Every initiative has ONE Accountable person.
Mistake 4: Missing Governance
What it looks like: AI projects report whenever they feel like it. No regular reviews. No coordination between initiatives.
Why it fails: Problems fester. Dependencies get missed. Budget overruns happen silently.
Fix: Establish weekly/monthly/quarterly governance cadence before starting AI work.
Mistake 5: Vanity Metrics
What it looks like: Tracking “model accuracy” or “automation percentage” without connecting to business outcomes.
Why it fails: You optimize for metrics that don’t matter while missing actual business impact.
Fix: Every AI KPI must cascade to a strategic pillar KPI. If it doesn’t, it’s the wrong metric.
Moving Forward
Week 3 answered the critical question: where does AI fit in your strategy?
You now have:
-
- Strategy Outcome Map showing where AI has maximum impact
-
- AI Opportunity Assessment identifying Quick Wins and Strategic Bets
-
- KPI Cascade connecting AI to corporate goals
-
- RACI Matrix assigning clear ownership
-
- Governance Operating Model ensuring coordination
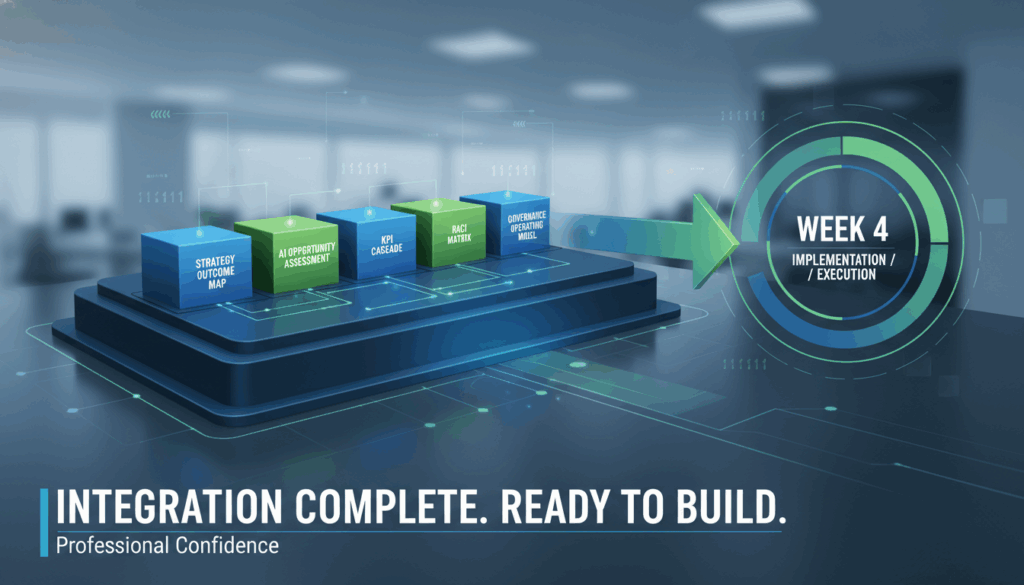
Next week: Week 4 covers AI implementation execution. How to actually build and deploy the AI initiatives you’ve identified, with governance that ensures they deliver promised business value.
For now, complete your AI-Corporate Strategy Integration. Map outcomes, assess opportunities, cscade KPIs, assign ownership and establish governance.
Then you’re ready to build AI that actually matters.
Download: RACI Matrix Template + AI Governance Operating Model
Get the templates to document your AI-strategy integration, assign clear ownership, and establish governance.
Week 3: AI-Corporate Strategy Integration
Part of the Strategic Foundation Framework by EQ-AI Bridge Advisory LLC
Next: Week 4 – AI Implementation Execution (Coming Next Week) Previous: Week 2 – The Strategic Foundation Diagnostic